
EVERY NEW CAR (light vehicle) sold in Australia is required to carry a sticker on the front windscreen giving fuel consumption figures. Such figures can help you make an informed choice when buying a new car, but what do they really mean? And how accurate are they?
Manufacturers test their own vehicles using a standardised test format approved by the government to define fuel consumption data. Of course, these figures are achieved under controlled conditions, so often aren’t replicated in the real world – that’s why seniordriveraus includes the manufacturer’s claimed fuel consumption and also includes the fuel consumption figure we achieved during testing. Sometimes, there’s a wide variation between these two figures. Occasionally, we manage to better the manufacturer’s quoted fuel consumption figure, but that will very much depend on driving conditions and how frugally we drive (we try to replicate the conditions most people will experience in day-to-day driving), and usually only when the test includes sustained non-urban driving.
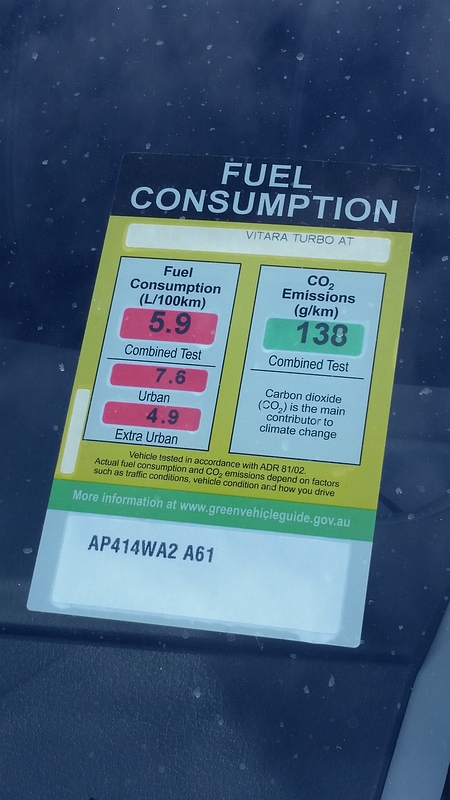
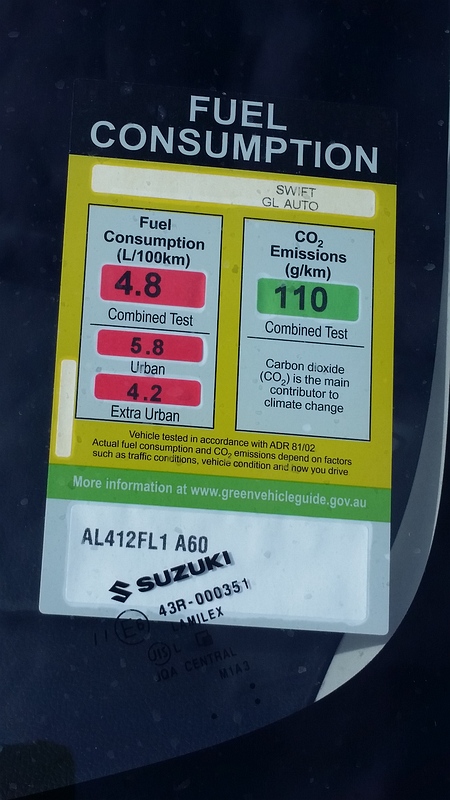
The fuel consumption label is displayed on the front windscreen of all new vehicles including passenger cars, four-wheel drives and light commercial vehicles up to 2.5 tonnes GVM (gross vehicle mass). The label shows the vehicle’s fuel consumption in litres of fuel per 100km (L/100km) and its carbon dioxide emissions in grams per kilometre.
Since it is impossible to consistently duplicate on-road testing with the many variables involved, these fuel consumption figures are not representative of the fuel consumption you may achieve, but they do provide a basis for consistent comparison between vehicles. In everyday driving, any number of things will affect fuel consumption including traffic conditions, how you drive and the condition of your vehicle.
The label shows three different fuel consumption figures: urban, extra-urban and combined, plus the combined CO2 value. Obviously, driving in urban conditions creates a higher fuel consumption, often as much as 20 to 50 percent higher than the combined value. The extra-urban test is not a traditional highway cycle, rather it is a high-speed test that may give a better indication than freeway or highway driving.
These figures are attained based on specific tests under standardised, carefully controlled conditions in specialised vehicle emission laboratories and subject to audit by the government. The 20-minute test cycle is split into two parts. The first is the urban cycle which represents conditions found in stop-start traffic. The extra-urban cycle involves the vehicle accelerating to a high peak speed. The weighting of the urban and extra-urban figures determines the combined test result based on the distance travelled in each part of the cycle.
Most vehicles show much higher fuel consumption in the urban part of the test which uses a low average speed (19km/h), idling periods (30 percent) and frequent stopping and starting. The extra-urban cycle has a relatively high average speed (63km/h) and a peak speed of 120km/h. It varies from a typical highway cycle in that it does not maintain a relatively constant speed over a period of time (as is the case for people driving on highways and freeways) but does approximate freeway or highway driving.
By all means use the fuel consumption label as a point of comparison, but bear in mind that your actual fuel consumption may be considerably different. The seniordriveraus fuel consumption figure (and that shown by other reviewers) is based on real world driving but not under strictly controlled conditions – in other words, the same driving conditions you will face day-to-day. As a result, these figures can only ever be an indication of the fuel consumption you may achieve. When we quote fuel consumption figures, we also tell you over how many real-world kilometres we achieved these figures, and we strive to record them under conditions as equal as we can realistically achieve. On the other hand, if we are testing an SUV off-road, or a performance car at or near its limits, the fuel consumption figures attained will be higher than cars we drive under a combination of highway and urban conditions.
So be aware the “official” fuel consumption figures, our own figures and those you achieve may vary considerably. And remember that fuel consumption is only one factor in the overall cost of ownership – don’t forget servicing costs, running costs and depreciation, any one of which can be a larger expense over the life of your vehicle than a fuel consumption figure that saves you a few tenths of a litre every 100 kilometres.